About 26% of Uzbekistan’s exports fall to share of energy and oil products
22/11/2010 13:45
About 26% of Uzbekistan’s exports fall to share of energy and oil products
22/11/2010 13:45
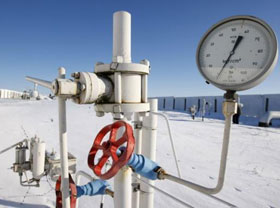
Tashkent, Uzbekistan (UzDaily.com) -- Energy and oil products made up main part of exports of Uzbekistan in the first nine months of 2010. Share of energy and oil products in total exports of Uzbekistan made up 25.7% in the reporting period against 35.5% in January-September 2009, the State Statistics Committee of Uzbekistan said.
The second main export item of Uzbekistan was services, share of which made up 10% in total exports of Uzbekistan in January-September 2010 (8.9% in January-September of 2009).
Food products claimed the third place with the share of 8.3% in January- September 2010 against 4.7% in the same period of 2009, the committee said.
Share of cotton-fiber in exports of Uzbekistan made up 8.1%. Share of chemical products in exports was 5%, ferrous and non-ferrous metals – 6.7% and machinery and equipment – 4.9%.
The main import items of Uzbekistan were machines and equipment, which accounted 46.3% of imports (57.6%) in the reporting period.
Uzbekistan imported chemical products and plastics (14.9% in total imports), food products (10.6%), ferrous and non-ferrous metals (8.4%) and service (4.7%), as well as energy and oil products (2.9%).
Foreign trade turnover of Uzbekistan made up US$15.507 billion in January-September 2010 (+0.2% year-on-year). At the same time, Uzbekistan’s exports made up US$9.566 billion and imports – US$5.941 billion.
| Structure. in % | volume change. in % | ||
| January-September 2009 | January-September 2010 | in % compared to January-September 2009 | |
| Export | 100.0 | 100.0 | 10.9 |
| cotton-fiber | 7.8 | 8.1 | 16.5 |
| food products | 4.7 | 8.3 | 94.0 |
| of which consumer goods | 4.4 | 7.8 | 95.3 |
| chemical products and articles thereof | 4.9 | 5.0 | 11.3 |
| energy and oil products | 35.5 | 25.7 | -19.7 |
| ferrous and non-ferrous metals | 4.8 | 6.7 | 55.1 |
| machines and equipment | 2.7 | 4.9 | 103.8 |
| services | 8.9 | 10.0 | 24.5 |
| others | 30.7 | 31.3 | 12.9 |
| Import | 100.0 | 100.0 | -13.3 |
| food products | 8.9 | 10.6 | 3.9 |
| of which for production needs | 4.7 | 5.7 | 6.9 |
| chemical products and articles thereof | 10.9 | 14.9 | 18.3 |
| energy and oil products | 3.1 | 2.9 | 19.5 |
| ferrous and non-ferrous metals | 6.2 | 8.4 | 17.9 |
| machines and equipment | 57.6 | 46.3 | -30.4 |
| services | 4.1 | 4.7 | 0.5 |
| others | 9.2 | 12.2 | 14.4 |

26/07/2024Read more

26/07/2024Read more
| $ 1 | 12727.96 | +0.134% |
| € 1 | 13781.84 | +0.459% |
| ₽ 1 | 139.46 | +0.288% |